ResourcesEverything in One Place
What to Look for in Google Analytics
Google Analytics is a fantastic tool for understanding how your website is performing and checking up on the traffic coming into the site. With so much information at your fingertips, it can be paralyzing trying to figure out where to start. We've come up with three simple things you can check each time you log into Google Analytics that should give you the level of insight you need to check up on your website and marketing efforts. 1. Audience Overview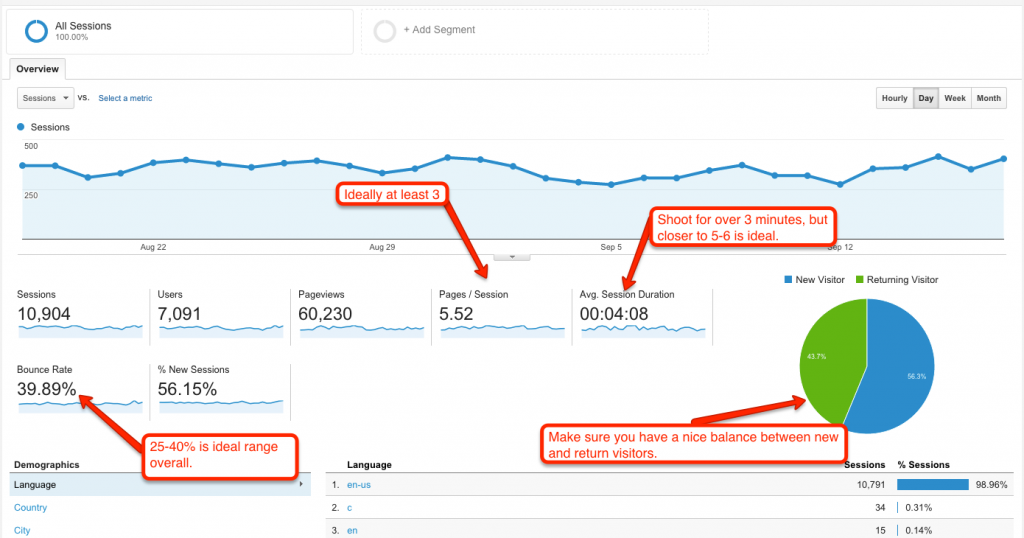 The Audience Overview is the default view when you log into analytics. Here you can get a snapshot view of the overall performance of everyone who has visited the site. You'll want to look at the bounce rate, time on site, and page views to understand if you're getting quality traffic and your website is appealing to the user. Additionally, take a look at your new vs. returning visitors section. Since most users won't fill out your lead form on the first visit, it's important to get people coming back to the site through online marketing efforts. Some users need to come back to the site at least three times before they're ready to make an appointment with you. 2. Acquisition Overview
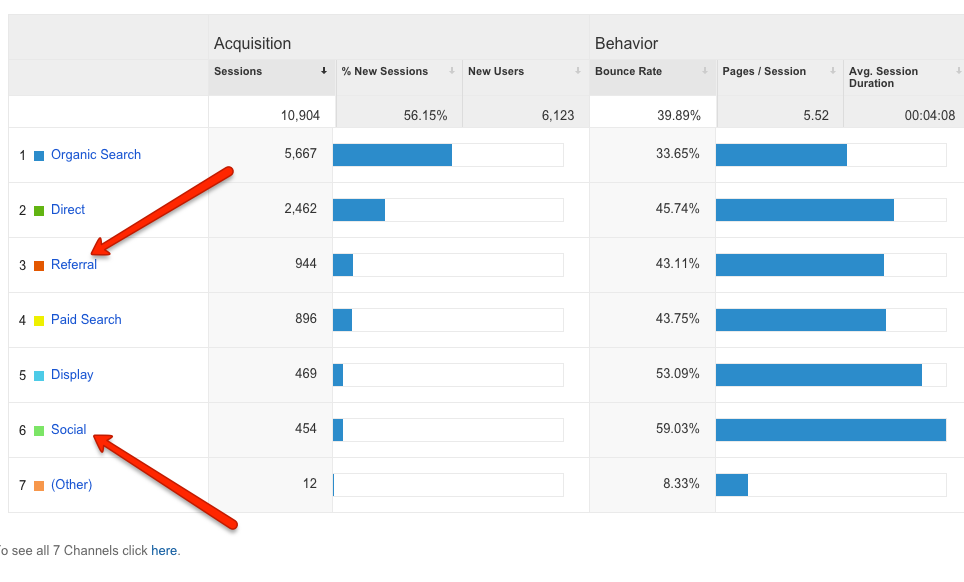 On the left hand side of the screen, you should be able to navigate down to Acquisition > Overview where you can get a snapshot of what Audience Overview told you, just broken out by traffic source. This will be helpful to diagnose which sources are quality and which are not. Likely you will want to look at Referral and Social if you're doing any sort of online marketing. Each of these list items contains a link to unpack the sources in that category, including bounce rate, time on site, and pages viewed. If Bounce Rate is 100% and time on site is 00:00, you know for sure that's spam traffic. Keep in mind that metrics for advertisements should be looked at differently than overall site metrics. A bounce rate between 40-60% is decent for ad traffic, and traffic from ads tend to have lower page views and lower time on site. 3. Search Queries
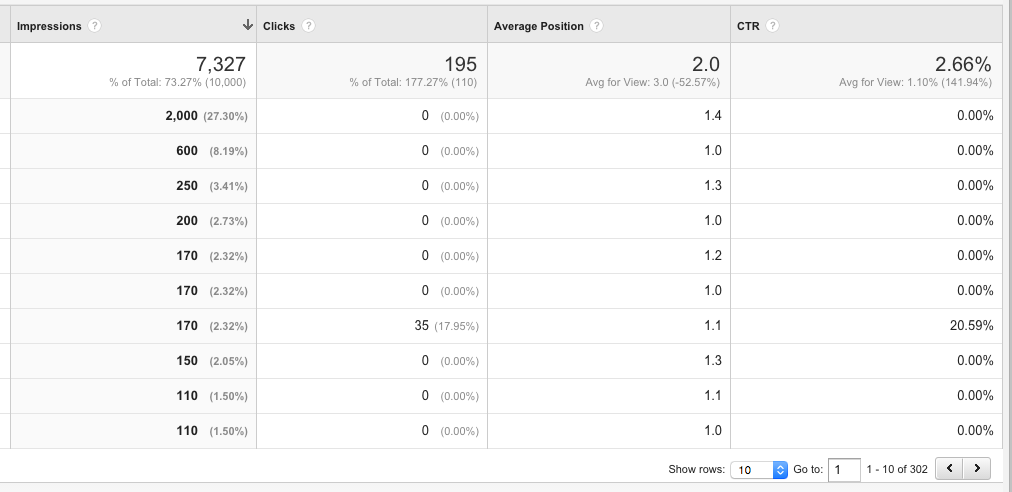 Under the Acquisition header, navigate to Search Engine Optimization > Queries to find which keywords are bringing people to your site. To protect our client's privacy, we've left out the keyword column, which exists to the left of "Impressions." Impressions tells you how many times your site showed up as a search result for a given keyword during the timeframe you've selected (the default is the past 30 days). The clicks column tells you how many people clicked your link, but keep in mind that 0 clicks on a high ranking keyword could just be an indicator that people are clicking adwords results more than organic search results. Don't pay too much attention to the Average Position column--because search results fluctuate and depend on many different factors (your mobile search ranking can vary by up to 6 positions depending on how good someone's Internet connection is), this isn't always a good reflection of how you're faring in the SERPs. The best way to check up on your ranking (besides your custom ranking report from Builder Designs) is to open up an "incognito window" in Google Chrome and do a search for the keyword you want to check on. If you'd like to go deeper into your analytics, a call with an SEO consultant is probably best. A lot of data is subject to interpretation, and there are lots of secondary dimensions that may provide even more insight into a particular thread of data. Our SEO team is always happy to help diagnose issues with your website, SEO, or marketing and can be reached by email at abby@builderdesigns.com or david@builderdesigns.com.
Latest Posts
June 29, 2026 | Blog
How ChatGPT and AI Tools Are Influencing Home Buyer Search Behavior
June 18, 2026 |
Two Builders. Two Breakout Paid Media Success Stories.
June 16, 2026 | Case Study
How a Home Builder Generated 118 Leads in 30 Days Using Performance Max
June 9, 2026 | Blog
Introducing: The AI Cornerstone Page by Builder Designs
June 1, 2026 | Blog
Your LinkedIn Page is now an AI Visibility Asset
May 29, 2026 | Blog
Google Marketing Live 2026: What Home Builders Need to Know
May 18, 2026 | Case Study
What Happens When You Compound Marketing, SEO and a Homebuilder Website
April 18, 2026 | Blog
5 Ways to Turn Website Visitors into Model Home Visitors
March 5, 2026 | EBook
Insights & Impact: 2026
Previous Article